Overview of the WeaMyL System
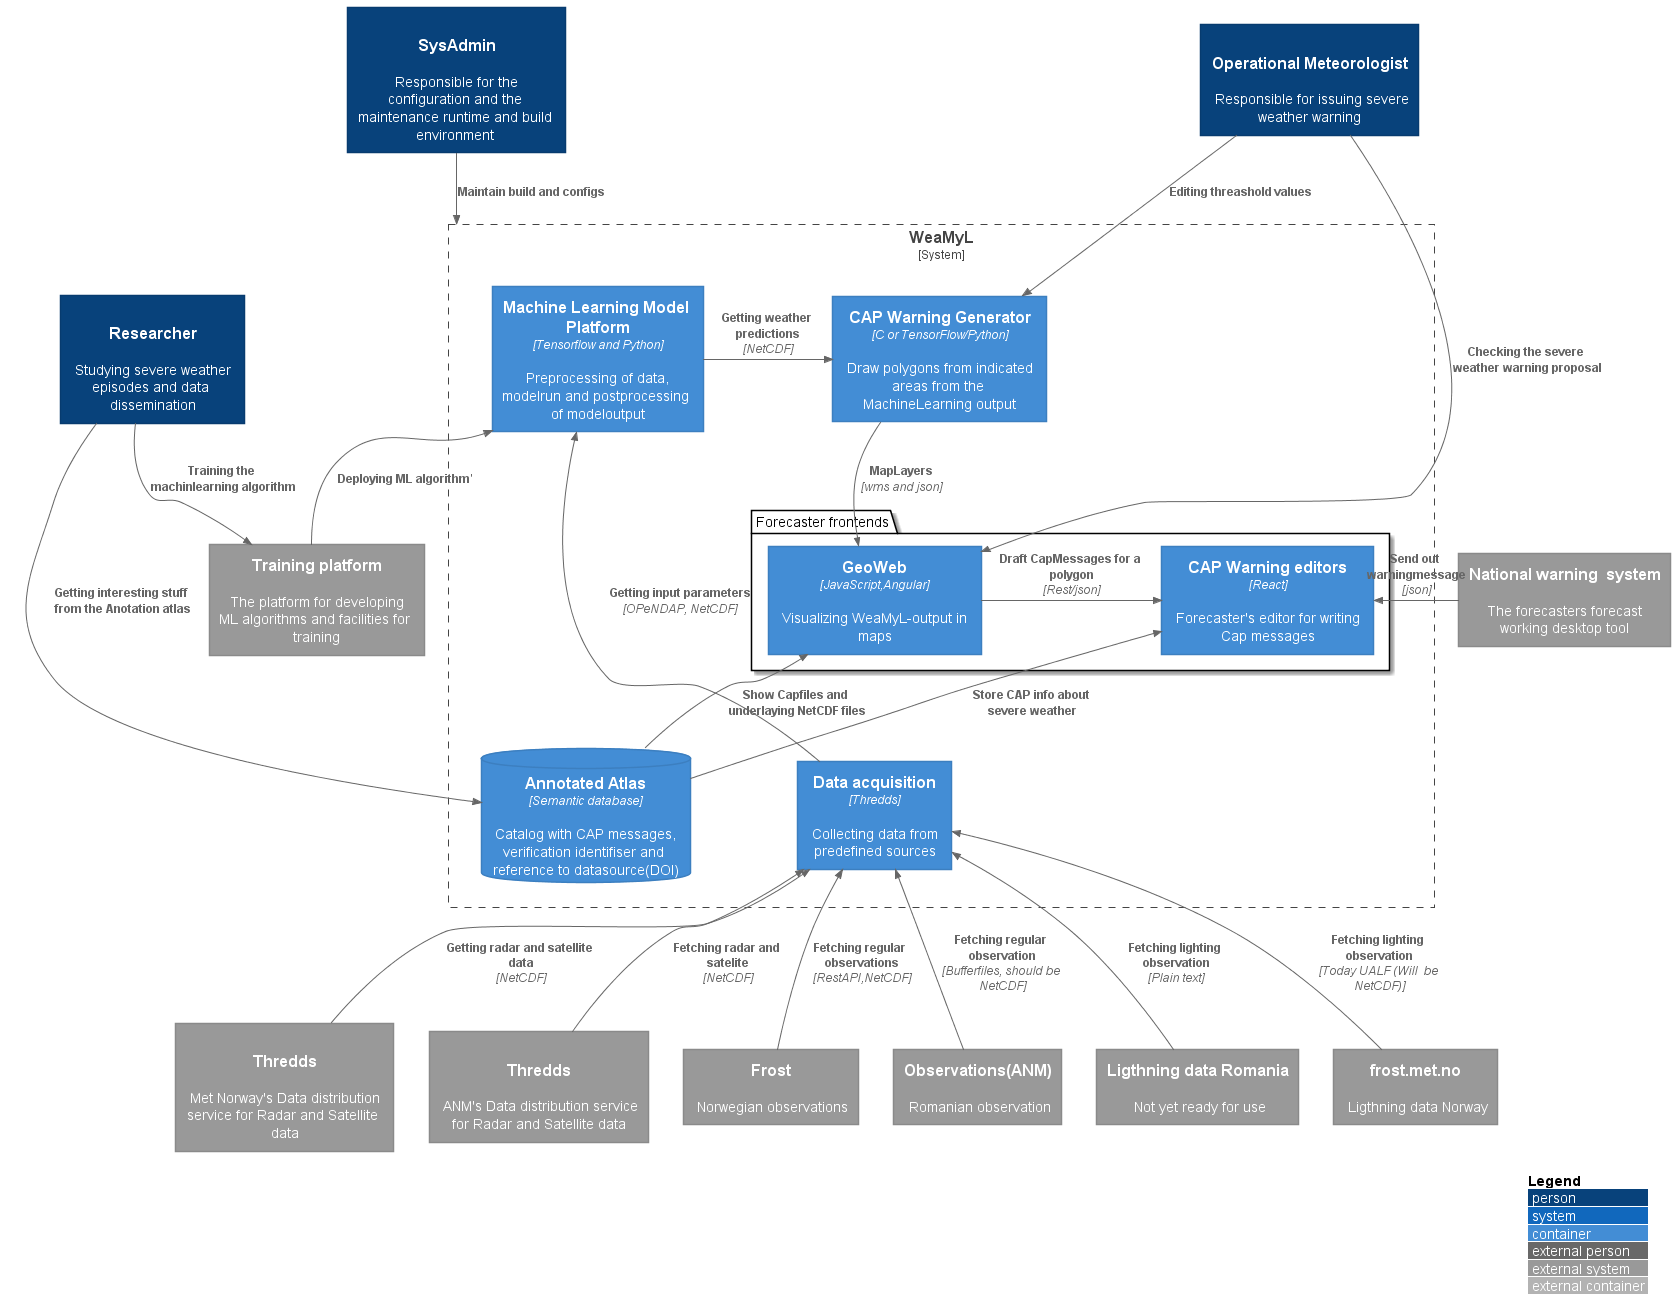
The forecasting platform consists of the following components:
-
GeoWeb - A web application used to visualize all kinds of meteorological data. That includes output from the machine learning algorithm and CAP warnings.
WebMapService providing data from the ML algorithms - Services providing all kinds of meteorological data, including model output satellite images, radar data, in situ observations as images that can be displayed on a map.
-
Machine Learning Algorithms - producing forecasts based on the latest recorded radar data sets.
-
CAP editor - editor used by the forecaster to produce CAP warnings.
-
CAP feed - service providing all issued CAP warnings.
Video 1. The video depicts a side-by-side comparison of the actual composite reflectivity, derived from data captured by the Bobohalma weather radar (shown in the left panel), and the predicted composite reflectivity generated by the WeaMyL model, specifically using the SepConv 2.0.0 prediction algorithm. This video is created through Visual Weather, the operational visualization software utilized by the Romanian Meteorological Administration. The featured event occurred on November 15, 2023, with data collected between 0:36 and 9:03 UTC. It's worth noting that the absence of azimuth sector data is due to a radar setting designed to limit the scanning volume; this restriction is only temporary and arises from the ongoing installation of a new meteorological radar at the site.
Video 2. An example illustrating the observed equivalent reflectivity factor (left) versus the forecast of XNow 1.0.0 (middle) versus the forecast of XNow 2.0.3 (right) using the Open GeoWeb mapping service for the weather event on June 28, 2022 at 09:55 UTC. This video is generated using the models, as the platform is intended to be used by meteorologists to analyze the weather 60 minutes into the future.
Video 3. This video is generated using the model XNow version 0.0.1, as the platform is intended to be used by meteorologists to analyze the weather 5 minutes into the future.
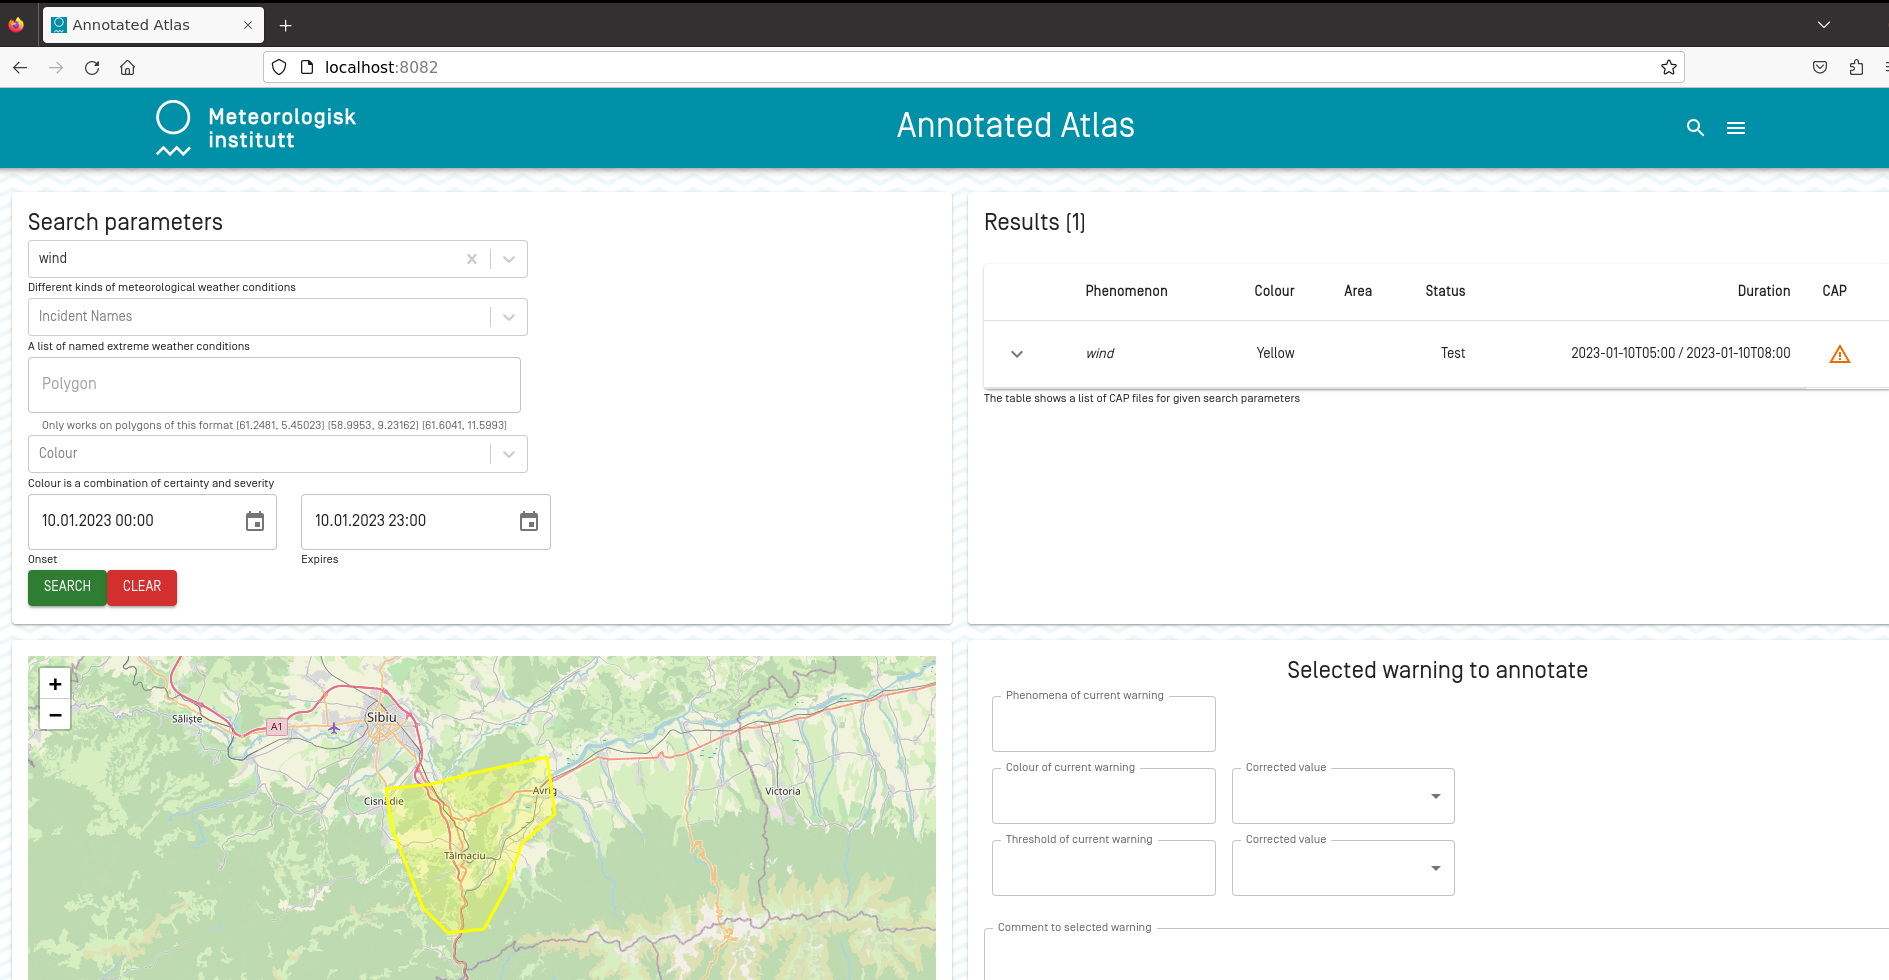
This component offers a web interface to a search engine connected to a semantic database which contains severe weather warnings. The web interface is easy to use and allows searching/filtering for different types of weather events and also for named weather events. The web interface also offers the possibility to investigate geographical areas affected by annotated and earlier events. In addition, It provides information about where to find the source data files, hence, providing support to the training machine learning models to detect interesting possible weather events. Figure 1 illustrates the Front-end GUI of the Annotated Atlas, deployed at MET.
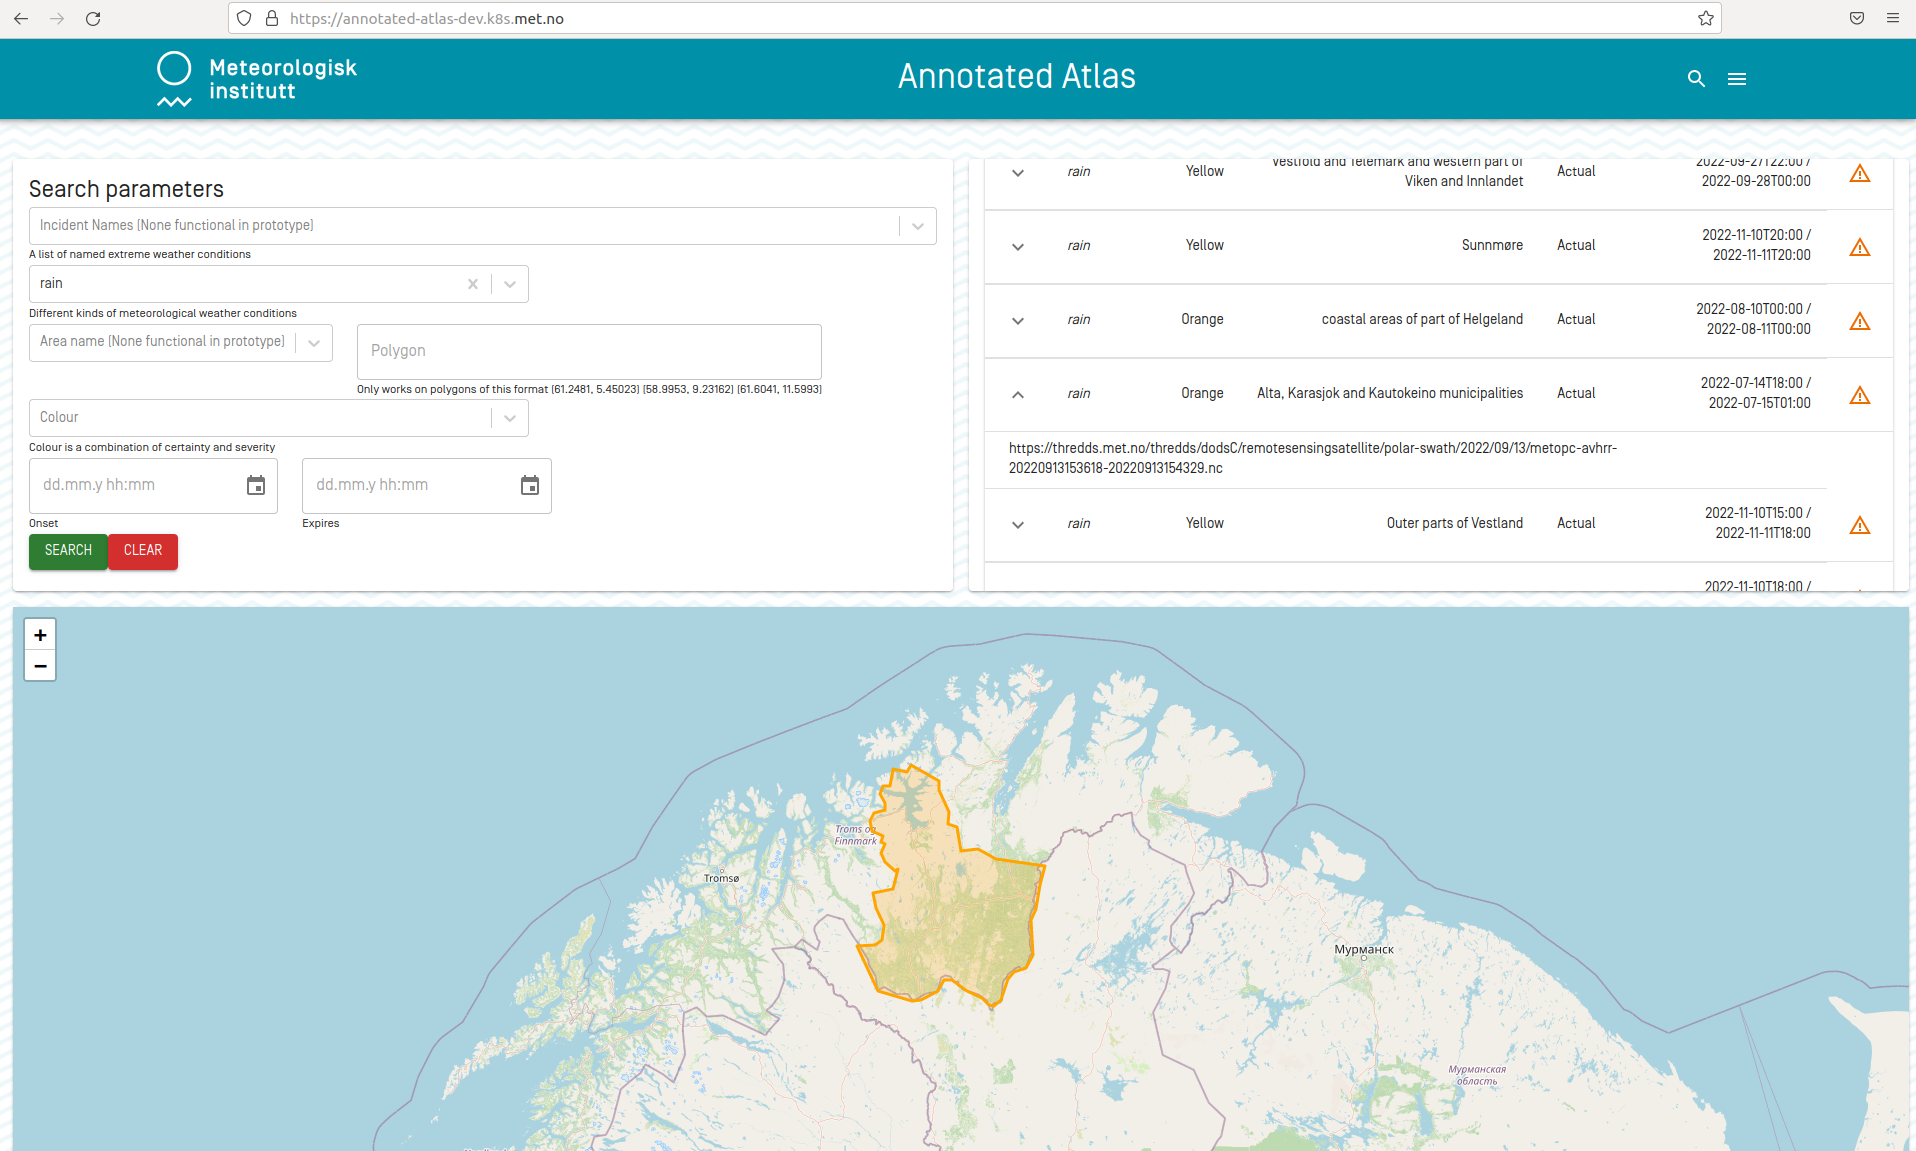
At NMA, the front-end of Annotated Atlas was successfully deployed on a dedicated server (Figure 2).